Markus Wallinger Receives Award of Excellence
On December 5, the Federal Ministry of Education, Science, and Research honored Markus Wallinger for his exceptional Dissertation.

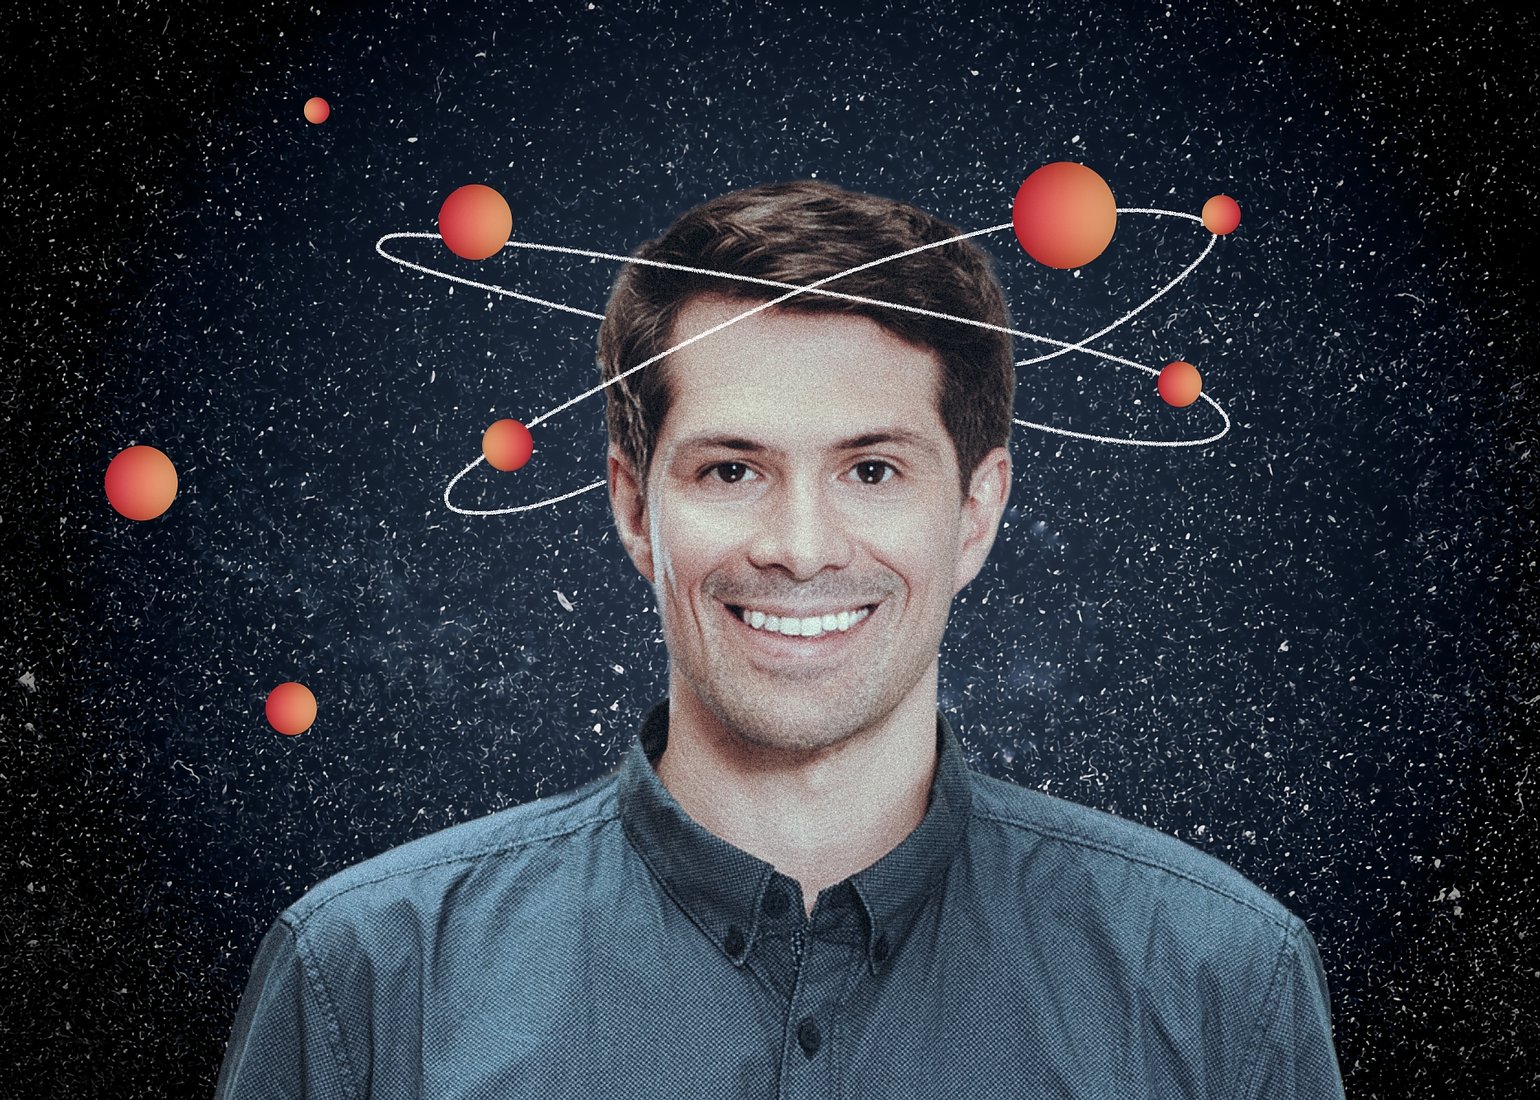
On December 5, 2024, the Austrian Federal Ministry of Education, Science and Research (BMBWF) honored the best Dissertations of the past academic year. We are delighted to announce that Markus Wallinger has received the Award for his Dissertation “Exploring Graph-based Concepts for Balanced Information Density in Data Visualizations”. He was supervised by Martin Nöllenburg, Professor of Algorithms and Complexity at TU Wien Informatics. The Award of Excellence – Staatspreis für die besten Dissertationen (State Prize for best Dissertation), endowed with 3,000 Euros, is awarded to only 40 Dissertations.
Markus Wallinger is a Postdoc at the Chair of Efficient Algorithms at the Technical University of Munich. His research focuses on algorithms for information visualizations, particularly set visualization and graph drawing. He is specifically interested in visualization metaphors, such as map metaphors, to create novel set visualization styles. In the domain of graph drawing, his work focuses on reducing visual clutter through combinatorial optimization of edge crossings and edge bundling. Markus Wallinger earned his bachelor’s degree in Computer Science from the University of Innsbruck and his master’s degree in visual computing at TU Wien Informatics, where he also completed his doctoral degree.
Congratulations!
Abstract
Information visualization is the practice of representing complex data through visual elements and graphical means to facilitate easier comprehension, analysis, and communication of patterns and insights. Assessing the effectiveness of a visualization is challenging because it involves considering multiple facets, such as variations in perception and cognition among individuals, differences in visual patterns across datasets, and the diverse nature of tasks. To some extent it is possible to capture effectiveness through quality metrics. A recurring concept within the realm of quality metrics is visual clutter, characterized by an excessive display of visual elements within constrained display space; conversely, the absence of clutter, represented by a low number of visual elements, may suggest inefficient utilization of the available display space. Hence, balanced information density is an indicator of an effective visualization.
In this thesis, we explore novel visualization approaches in the context of node-link diagrams and set visualization with balanced information density. In the context of node-link diagrams, we explore two clutter-reduction techniques. One such technique is edge bundling, wherein edges are visually clustered by distorting the lines in node-link diagrams. However, this approach often results in connections becoming ambiguous, compromising the faithfulness of the node-link diagram to the underlying data. We propose a novel edge bundling algorithm that avoids ambiguities in bundled drawings and remains faithful to the data. The second technique we explore involves filtering visual elements. Our focus is on Hive plots, a deterministic network layout technique that arranges vertices on radially emanating axes. By removing some of the deterministic behavior, we gain freedom in where we place vertices. This provides the advantage of easily concealing dense clusters within a network.
In set visualization, we try to adopt a different approach to achieve balanced information density. Specifically, we draw inspiration from visual metaphors found in the domain of (schematic) maps, an area extensively researched for its design implications. In an initial study, we investigate three set visualization systems, subjecting them to a comparison based on task and user performance. The outcomes imply that a schematic representation exhibits superior task performance. Building upon this understanding, we propose a novel set visualization technique that finds a suitable layout for set elements that is similar to tile maps while presenting the sets as an overlay. Lastly, we shift the focus towards increasing the density in information sparse set visualization. Here, we focus on linear diagrams and propose a novel extension that achieves a more compact representation while balancing visual clutter. Throughout this thesis we present multiple alternative variants for each approach and analyze them not only through computational quality metrics but also via user experiments, case studies, and expert interviews.
Curious about our other news? Subscribe to our news feed, calendar, or newsletter, or follow us on social media.


