Students Excel at the 2020 Graph Drawing Contest
Our students from the Algorithms and Complexity group won four prizes at the 27th Annual Graph Drawing Contest in Vancouver.
Picture: Rupert Ettrich, Julian Haumer, Samantha Fuchs
The 27th Annual Graph Drawing Contest, held (virtually) in conjunction with the 28th International Symposium on Graph Drawing and Network Visualization in Vancouver on September 15-18, 2020, was a big success for our graph drawing students from the research unit Algorithms and Complexity, winning the first prize in both creative categories, as well as one second prize and one third prize. Three out of these four winning layouts were created as part of the coursework for the lecture Graph Drawing Algorithms, taught by Martin Nöllenburg and Soeren Nickel.
The 2020 Graph Drawing Contest comprised two creative topics: The first data set was a small-scale social network of 43 chieftains and farmers and their interactions from the Icelandic Hrafnkels Saga. The second data set was a larger relationship network of thousands of Korean artists, bands, and record labels in K-Pop music. Participants were free to design an informative but, at the same time, aesthetically pleasing layout of these networks.
Hrafnkels Saga
Tamara Drucks, Moritz Leidinger, and Giulio Pace won the first prize with their idea of showing the Hrafnkels Saga as a spiral-shaped storyline layout embedded in a map of Iceland. The second place went to the team of Fabian Jogl, Melanie Paschinger, and Adrian Chmurovic. They used a layered graph layout on concentric half-circles to show the saga’s actors and events.
K-Pop
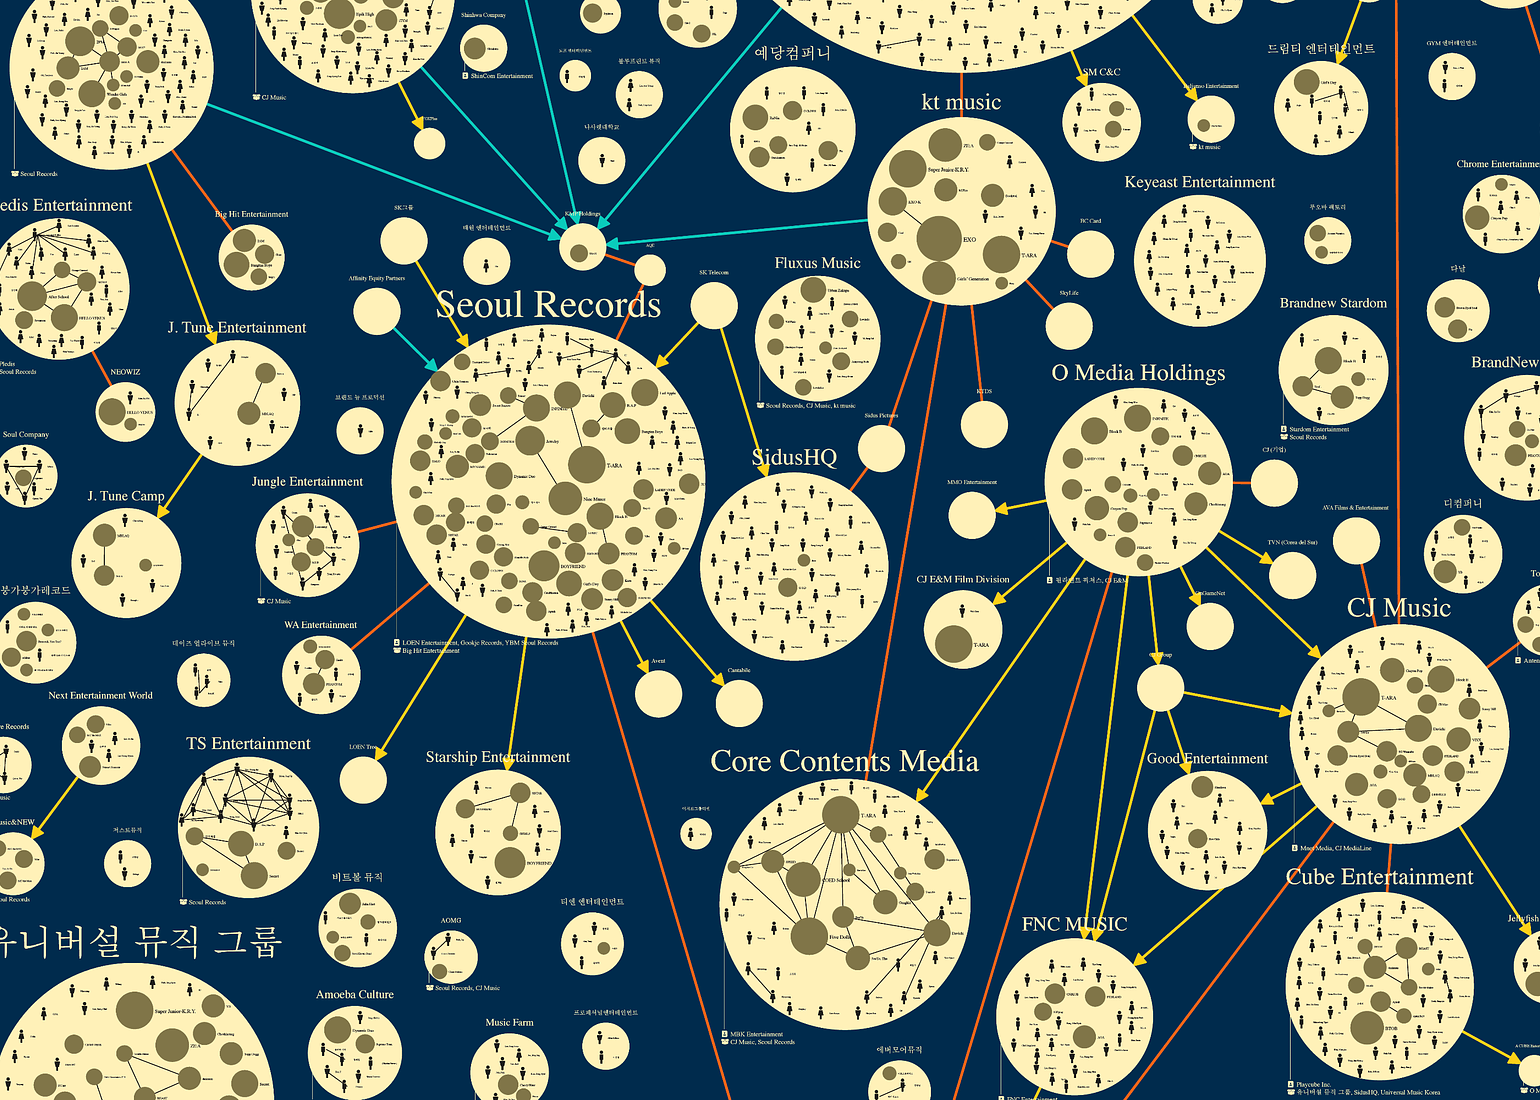
In the second category, Rupert Ettrich, Julian Haumer, and Samantha Fuchs won the first prize for their Map of K-Pop Stars as a collaboration network of artists and bands grouped by their record labels in the visual style of a celestial chart. The third place went to Markus Wallinger and Hsiang-Yun Wu, who used a matrix of hive plots to highlight several different aspects of the data set.
The International Symposium on Graph Drawing and Network Visualization
The International Symposium on Graph Drawing and Network Visualization has been the main annual event in geometric representation of graphs for more than 25 years. Its focus is on combinatorial and algorithmic aspects of graph drawing as well as the design of network visualization systems and interfaces. Graph drawing and network visualization are motivated by applications where it is crucial to visually analyze and interact with relational datasets. Examples of such application areas include data science, social sciences, distributed computing, information systems, biology, geography, business intelligence, information security, and software engineering. Researchers and practitioners working on any aspect of graph drawing and network visualization are invited to contribute papers and posters and to participate in the symposium and the graph drawing contest. GD2020 was organized by the University of British Columbia, Department of Computer Science, in cooperation with the Pacific Institute for the Mathematical Sciences and was held online due to the Coronavirus outbreak.
Curious about our other news? Subscribe to our news feed, calendar, or newsletter, or follow us on social media.